Tool Mentor: Reporting Defect Trends and Status Using Rational ClearQuest®
Purpose
This tool mentor describes how to create a Rational ClearQuest® chart to view defect trends and to generate a defect status report.
Rational Unified Process Related activities:
Overview
ClearQuest provides pre-defined charts and reports that allow workers, such as managers, to see the status of a project at a glance. It is also easy to modify charts and reports, and to create new ones.
Charts
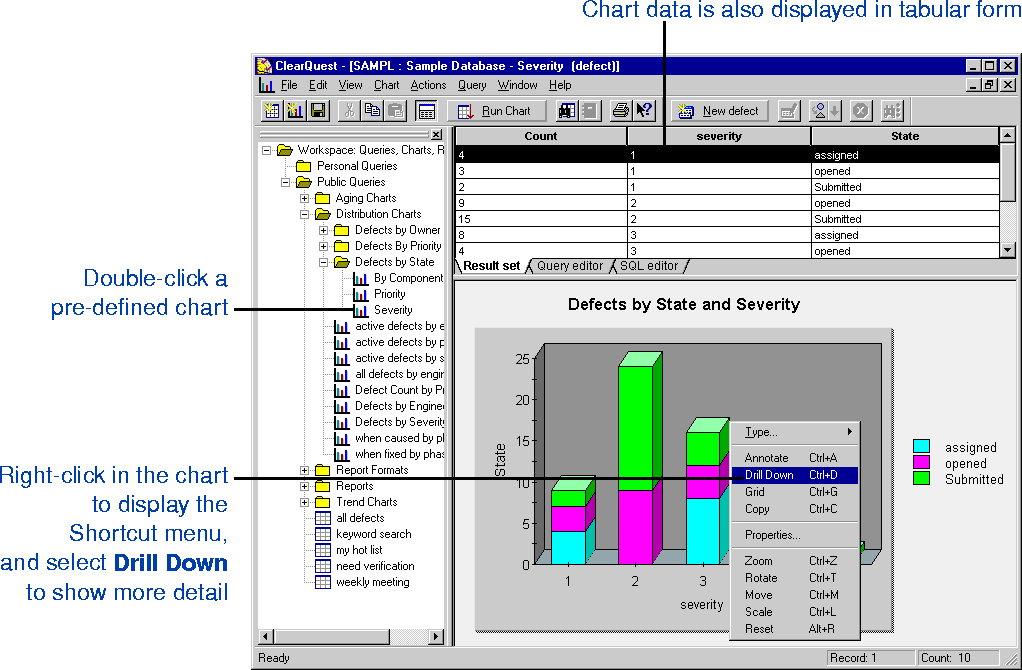
ClearQuest charts provide a graphical display of change request data. ClearQuest supports three kinds of charts: distribution charts, trend charts, and aging charts.
Distribution charts show how many records fit the categories or criteria of a query. For example, a project manager might generate charts showing:
- the current status of a group of records
- who has been assigned the most/least change requests
- which records have the highest priority
Trend charts show
- how many records were transitioned into the selected states by day, week, or month
- the rate at which new records are submitted, resolved, or moved into other states
Aging charts show how many records have been in the selected states for how long. Aging charts answers questions such as:
- How many defects have been open for less than one week?
- How many defects have been open for more than three weeks?
- How many defects have been postponed for more than two months?
Workers can chart the aging and trends of any state-based records (defects, enhancement requests, documentation requests, and more).
Reports
ClearQuest also allows workers to generate reports using existing queries. A ClearQuest report consists of a query inserted into a report format created by a third-party tool. A worker, such as a manager, creates a report format, then saves the report format in the ClearQuest Workspace. To generate a report, the worker chooses a report format, then specifies which query will have its results inserted into the report format. Reports are stored in the Workspace, and can be run at any time.
Tool Steps for Creating a Chart 
See ClearQuest Help > Working with charts > Using charts.
Tool Steps for Creating a Report
See ClearQuest Help > Working with reports > Creating report formats.
Tool Steps for Creating a Report from the Currently
Active Query
See ClearQuest Help > Working with reports > Generating query reports.
![]()